Venncilitation
Evaluating choices/ideas to solve a problem using a Venn Diagram, arriving at consensus in a quick, fun, easy and democratic way
Goal
A preferred decision-making facilitation process:
1. To map, the ideas generated based on two important factors:
(in this case):
i. Possible Solutions and
ii. Potential Impacts.
2. This act is done on different forms of Venn Diagrams.
3. This augments the decision makers to remain focussed and evaluate suggestions while taking actions.
Materials
Instructions
Prior Knowledge for the Facilitator: Basic Knowledge of Venn Diagram
Facilitators may read about the importance of Venn Diagram
Set Up
Below process describes an in-person facilitation set up and process.
Depending on group size, either a circle of chairs, or tables set up for small groups to interact.
Before:
1. Fix One Sticky Walls on the Walls (Or similar Set up).
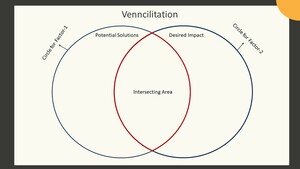
2. We will create one big circle towards the left with the paper tapes on the Sticky wall. This will work like circles of a Venn Diagram. (as shown in the attachment)
3. Keep the Other Materials Ready for making another circle on the right side of the sticky wall after Step 6 During the facilitation process.
During:
1. Distribute Sticky notes and Colour Markers
2. Depending upon the context of the programme, this process can be used based on the problem identified by the participants.
For Example: In my programme for the Divisional Sales Managers (DSMs) of a Pharma Company, they wanted to arrive at the solution for (problem) motivating the Doctors about the Prescription Writing Behaviour.
3. Then facilitate the participants to arrive at “What they Think are the Two Major Factors that can lead towards a Proper Solution.
For Example: In my programme the DSMs together arrived at two major important Factors such as 1. In clinic Activities and 2. Impact on the Doctors. Therefore, for clarity we consider the two factors as Activities and Impact (without altering its meanings as understood by the participants)
4. Now to generate ideas for Factor – 1, we asked each participant to write down as many possible (in clinic) activities that can act as the possible solutions. One can write as many solutions as possible on the front side of the sticky note and only one solution in each sticky note. If one participant wants to write more points, then he/ she can use as many sticky notes as possible.
5. As the facilitator you take a sticky note and write on it the first factor (in this case it is “Activities”) and paste it within the left side big circle towards top on the sticky wall.
6. Now ask all the participants to paste sticky notes with their solutions for Factor-1 (“Activities”) in this big circle on the sticky wall and then ask them to occupy their original seats.
7. Further to generate ideas for Factor - 2, ask each participant to write down what all impacts they expect. One can write as many impacts expected as possible on the front side of the sticky note and only one in each sticky note. If one participant wants to write more points, then he/ she can use as many sticky notes as possible.
8. Now as the facilitator makes a big circle towards the right side of the sticky wall and takes a sticky note and writes on it the second factor (in this case it is “Impact”) and paste it towards top within the big circle which is now made on the right side on the sticky wall.
9. Now ask all the participants to paste sticky notes with their solutions for Factor-2 (“Impact”) on the right-side circle.
10. Now around the sticky wall, facilitate a discussion amongst the participants to choose only those solutions from the Activity circle (“Factor - 1”) that can create an impact (“Factor - 2”) and paste it in the intersecting area between the two circles (as shown in the Attachment).
11. Let the discussion continue, so that participants find out which are important solutions (Factor-1) within the intersection area that can work as solution to contribute to the optimum impact (Factor-2). Let the participants settle and accept the solutions.
Optional:
12. You can now facilitate them to think of a Third Factor (In my Programme participants mentioned it as “Cost Effective”) and then you can continue the process for a third circle in the Venn Diagram.
After:
1. You can further facilitate the above data (information) for any additional solution (In my programme it was “creating Implementation strategy)
You may move to the next exercise.Attachments
- Vencilitation.jpg
Background
I realised the power of Venn Diagram in creating many solutions and therefore, thought of including it as a facilitation technique. Since there is combination of both The Venn Diagram and The Process of Facilitation, therefore thought of naming it as Venncilitation. This works with impact in many workshops that I use to do. The process explained here, is an example of A ∩ B (read as A intersection B). Means what is common in both Set A and Set B. Similarly other forms of relations such as A U B, A U B, A⊂B etc. can be used in this Venncilitation.
1 Ratings
1 Comments
 Dr. Swati Padoshi
I have used this method. And this is a very powerful and productive facilitation tool. Thanks Dr.Mangesh for this sharing this knowledge