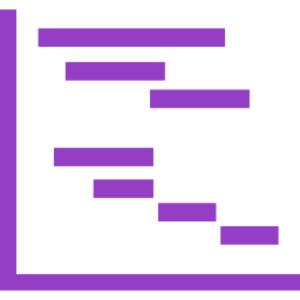
Gannt Chart
This process is used to aid in planning projects by showing all activities that have to take place in the chronological order so as to reach a goal.
Goal
The intent of this method is to create a chart that helps to keep the goal in sight and schedule the key steps and milestones..
Materials
Instructions
Before
Setting: A computer in order to create the chart is needed, a professional program might be helpful.
Number of participants: The group can be of any size as all the names can be included in the chart, but do not have to be in it.
Types of participants: Any types of participants can be involved in this process.
Time needed: The time varies depending on the amount of information that is wanted to be included in the chart.
Pre-Work Required: A frame work for the chart could be prepared by the facilitator.
Type of Facilitator-Client Relationship: A special Facilitator-Client Relationship is not neccesary.
Facilitator personality fit: The facilitator does not need any particular characteristics, but should be able to work with the computer so as to create the chart (with a professional program).
During
1. At first, all the activities that will have to be carried out, in order to implement a solution, have to be listed.
2. Secondly, the facilitator and/or the group has/have to determine when each activity must start, in order to complete the whole process, and then list them in a chronological order.
3. Next, a framework for the Gantt chart has to be created, listing the month (weeks, etc.) of implementation across the top of the table, and then list the activities down the side on the left.
4. Now, mark a starting date for each activity, and then determine a duration for each activity. Now, using a horizontal bar, mark the duration of the activities on the graph. Continue this step, until each activity has its own column.
5. The last step is to simply review the chart and then determine if it is possible to carry out all the activities listed simultaneously, or see if there is any room for improvement.
After
Follow-Up Required: The chart has to be placed for everyone to see it, in order to check whether every action etc. is still in the assed time frame.
Usual or Expected Outcomes: The tangible outcome is a chart, that depicts the different components in a chronological order in order to be able to keep track of a process.
How success is evaluated: The process is successful when a Gantt chart has been created and the different components and their progress can be monitored.
Online Tips
The same process may be used online using an online Gannt Chart App or whitebord template. Breakout groups may assigned to develop aspects of the plan.
Attachments
- chart-gantt.png
Background
Source: Henry L. Gantt (1861-1919)